Understanding the Interface
Neurode MIDI has a clean, musician-first interface designed for quick access to everything you need.
Main Tabs
Neurode MIDI uses a tab-based interface to organize its features:
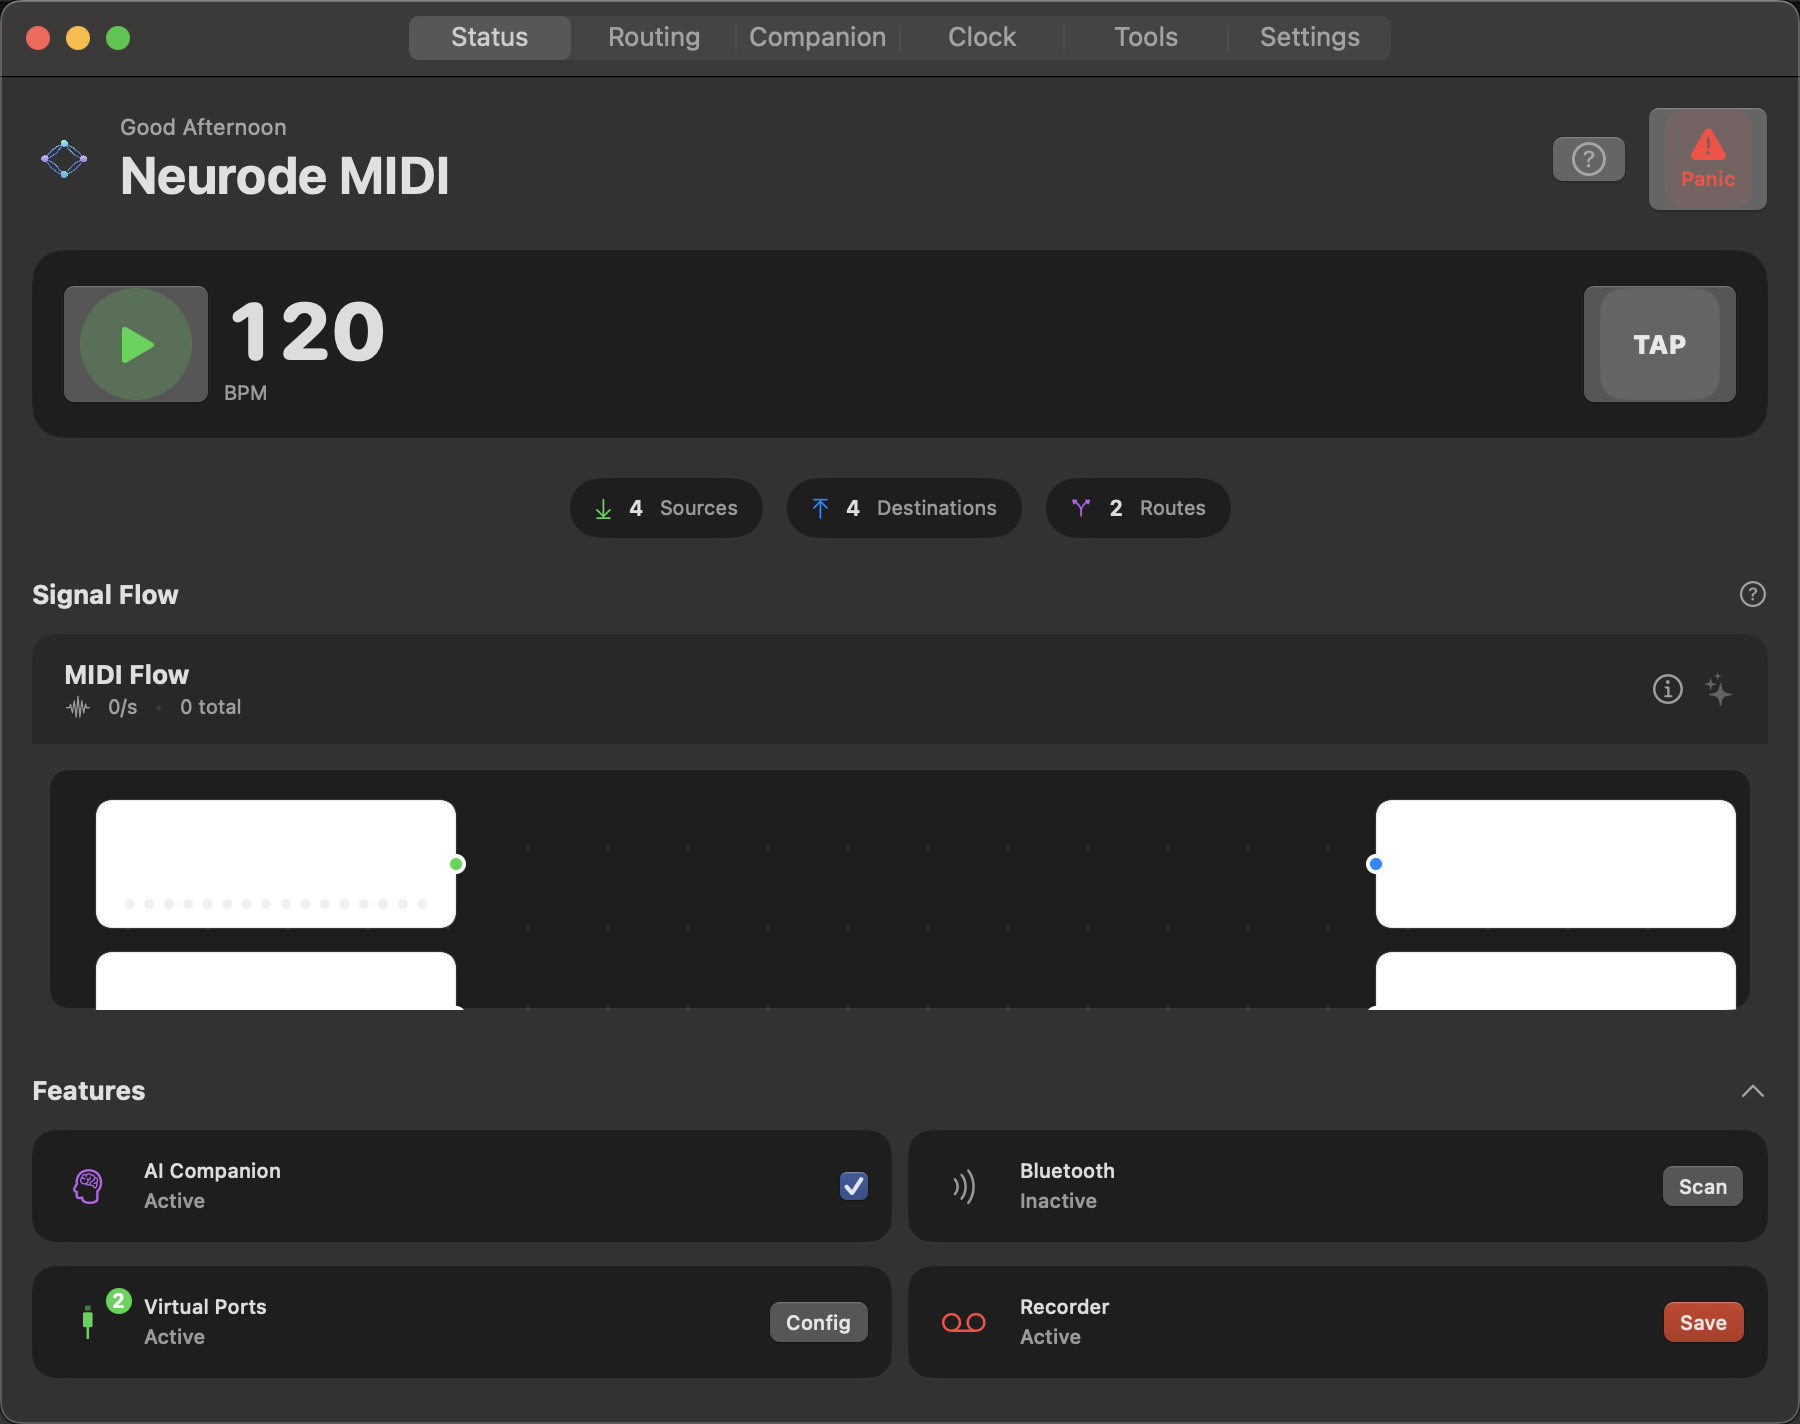
Status Tab
The dashboard showing your MIDI system overview at a glance.
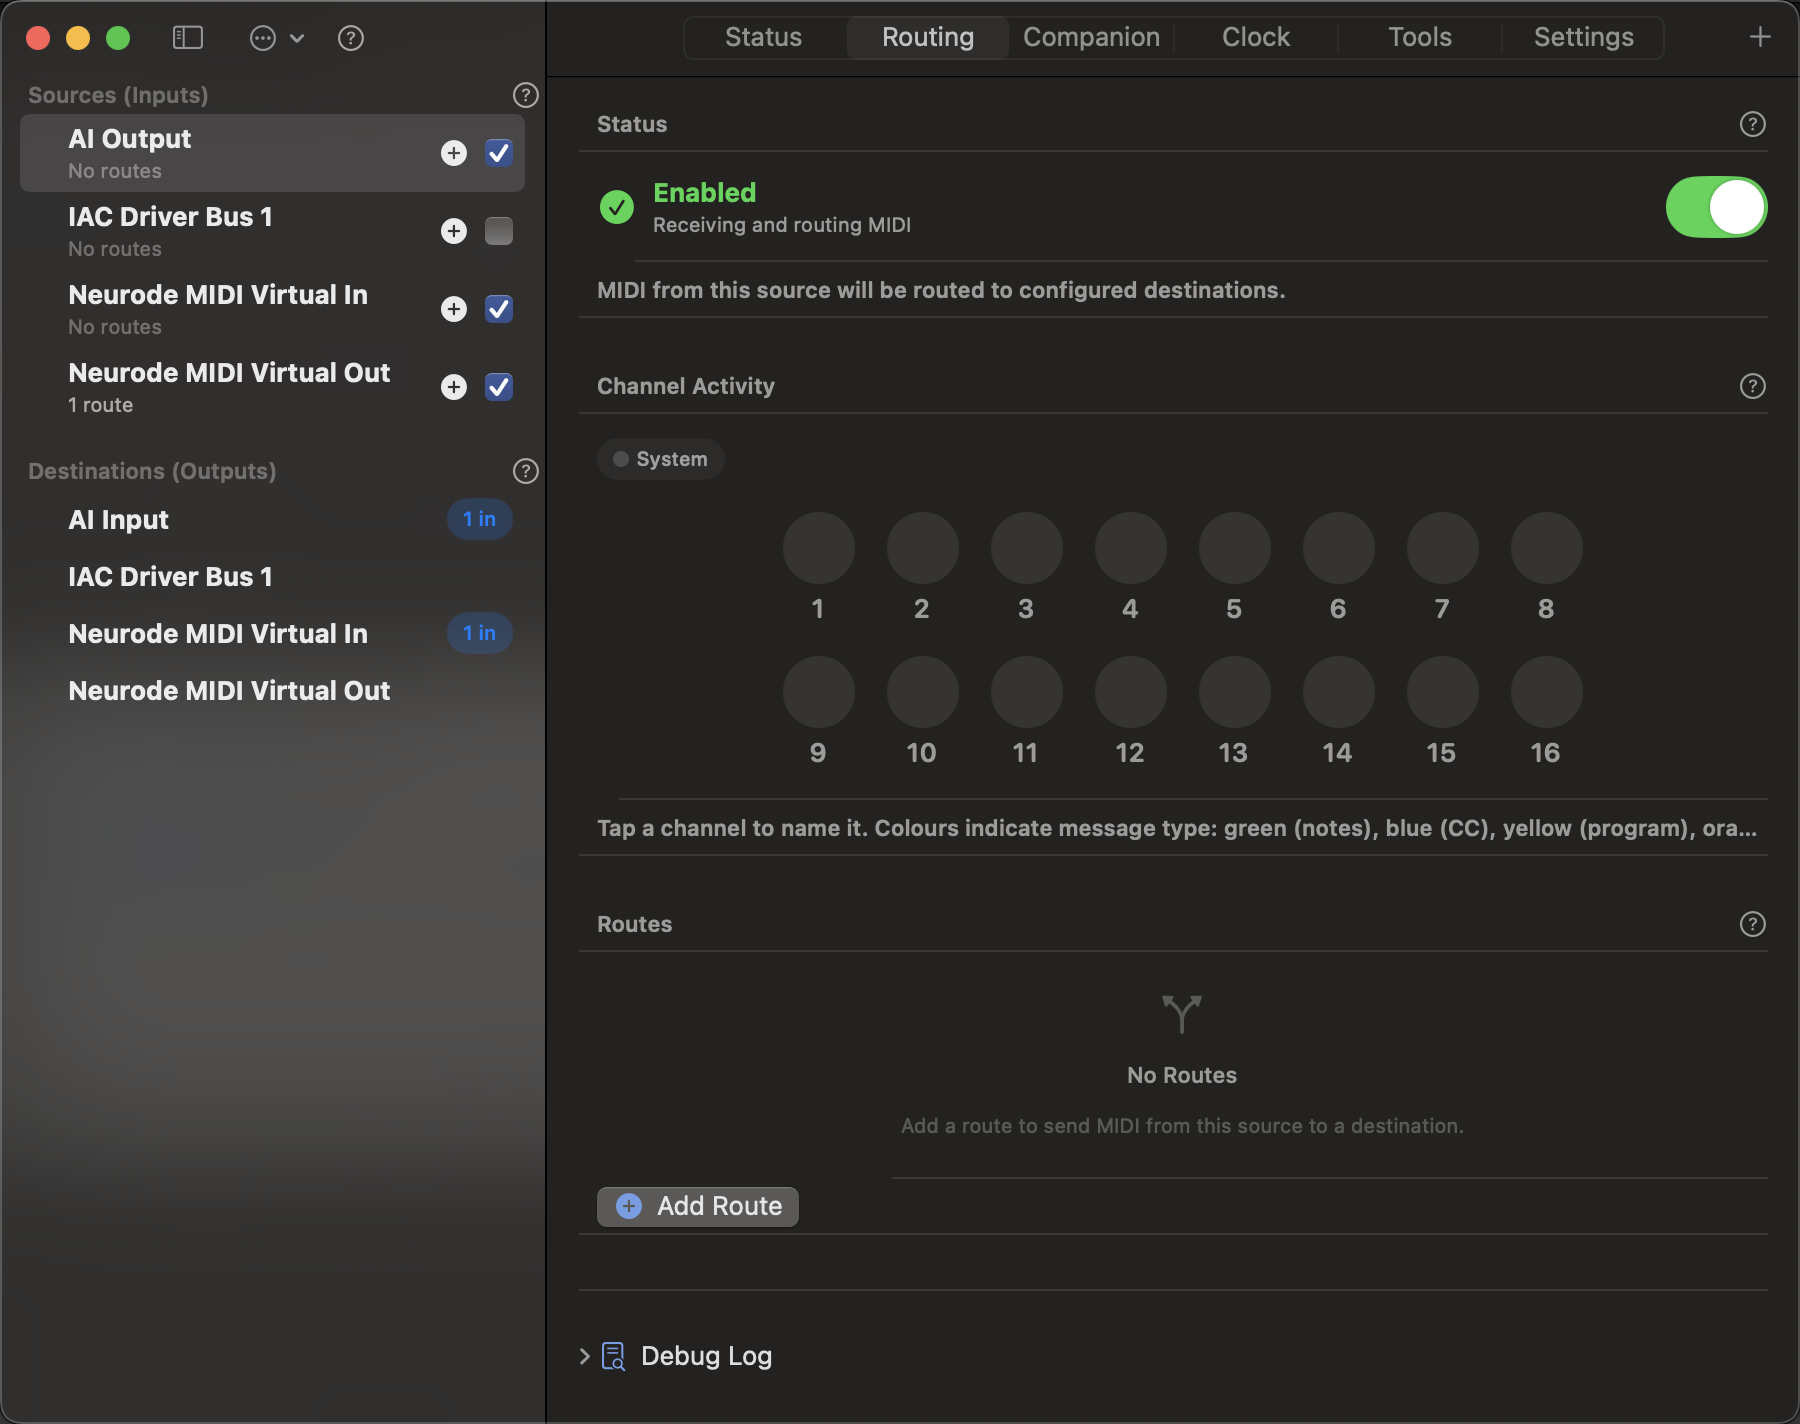
Routing Tab
Manage MIDI routing between sources and destinations.
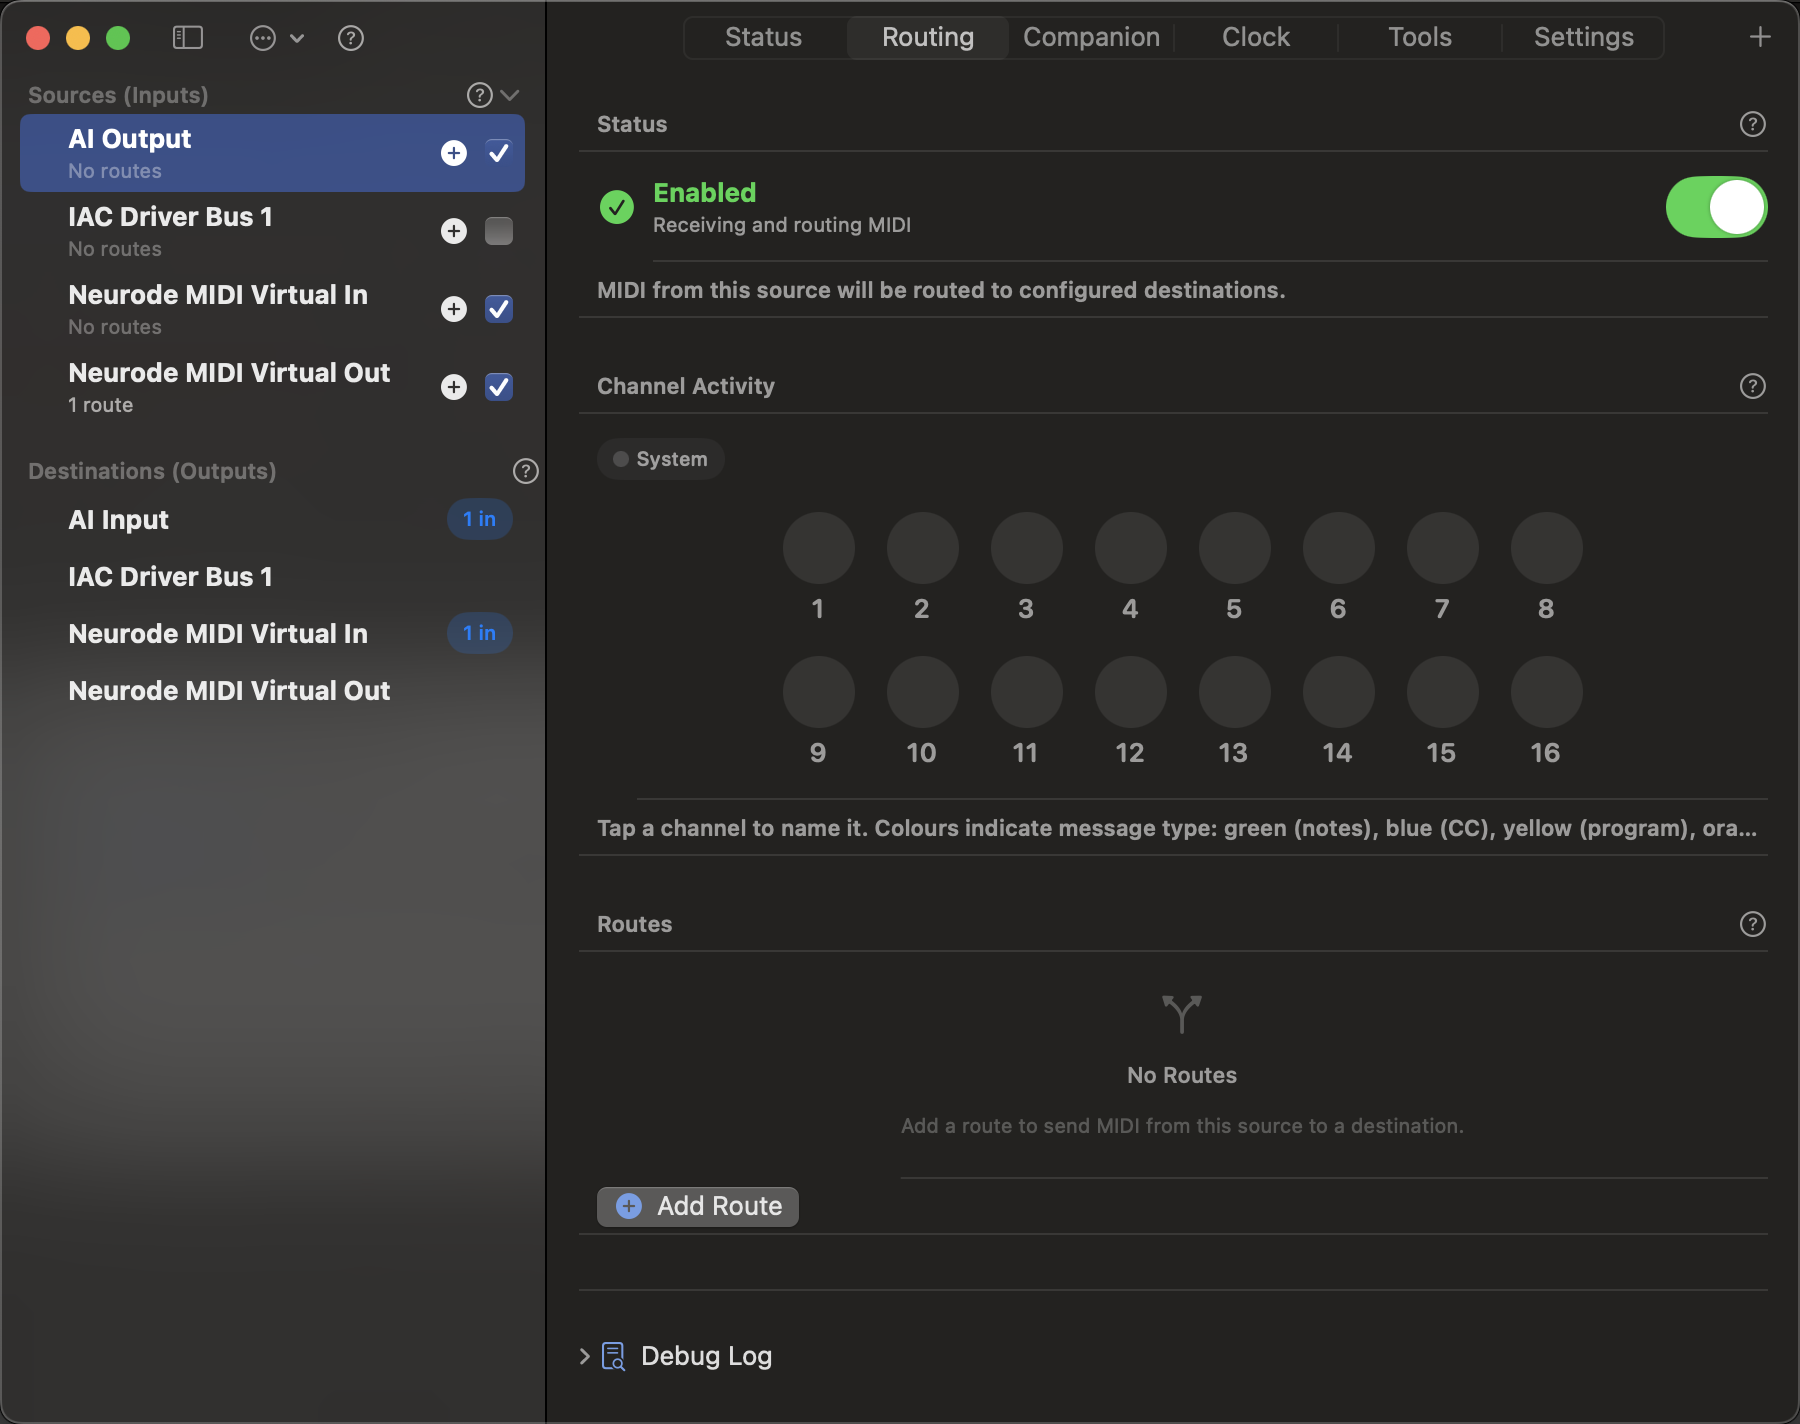
View detailed information about each source or destination:
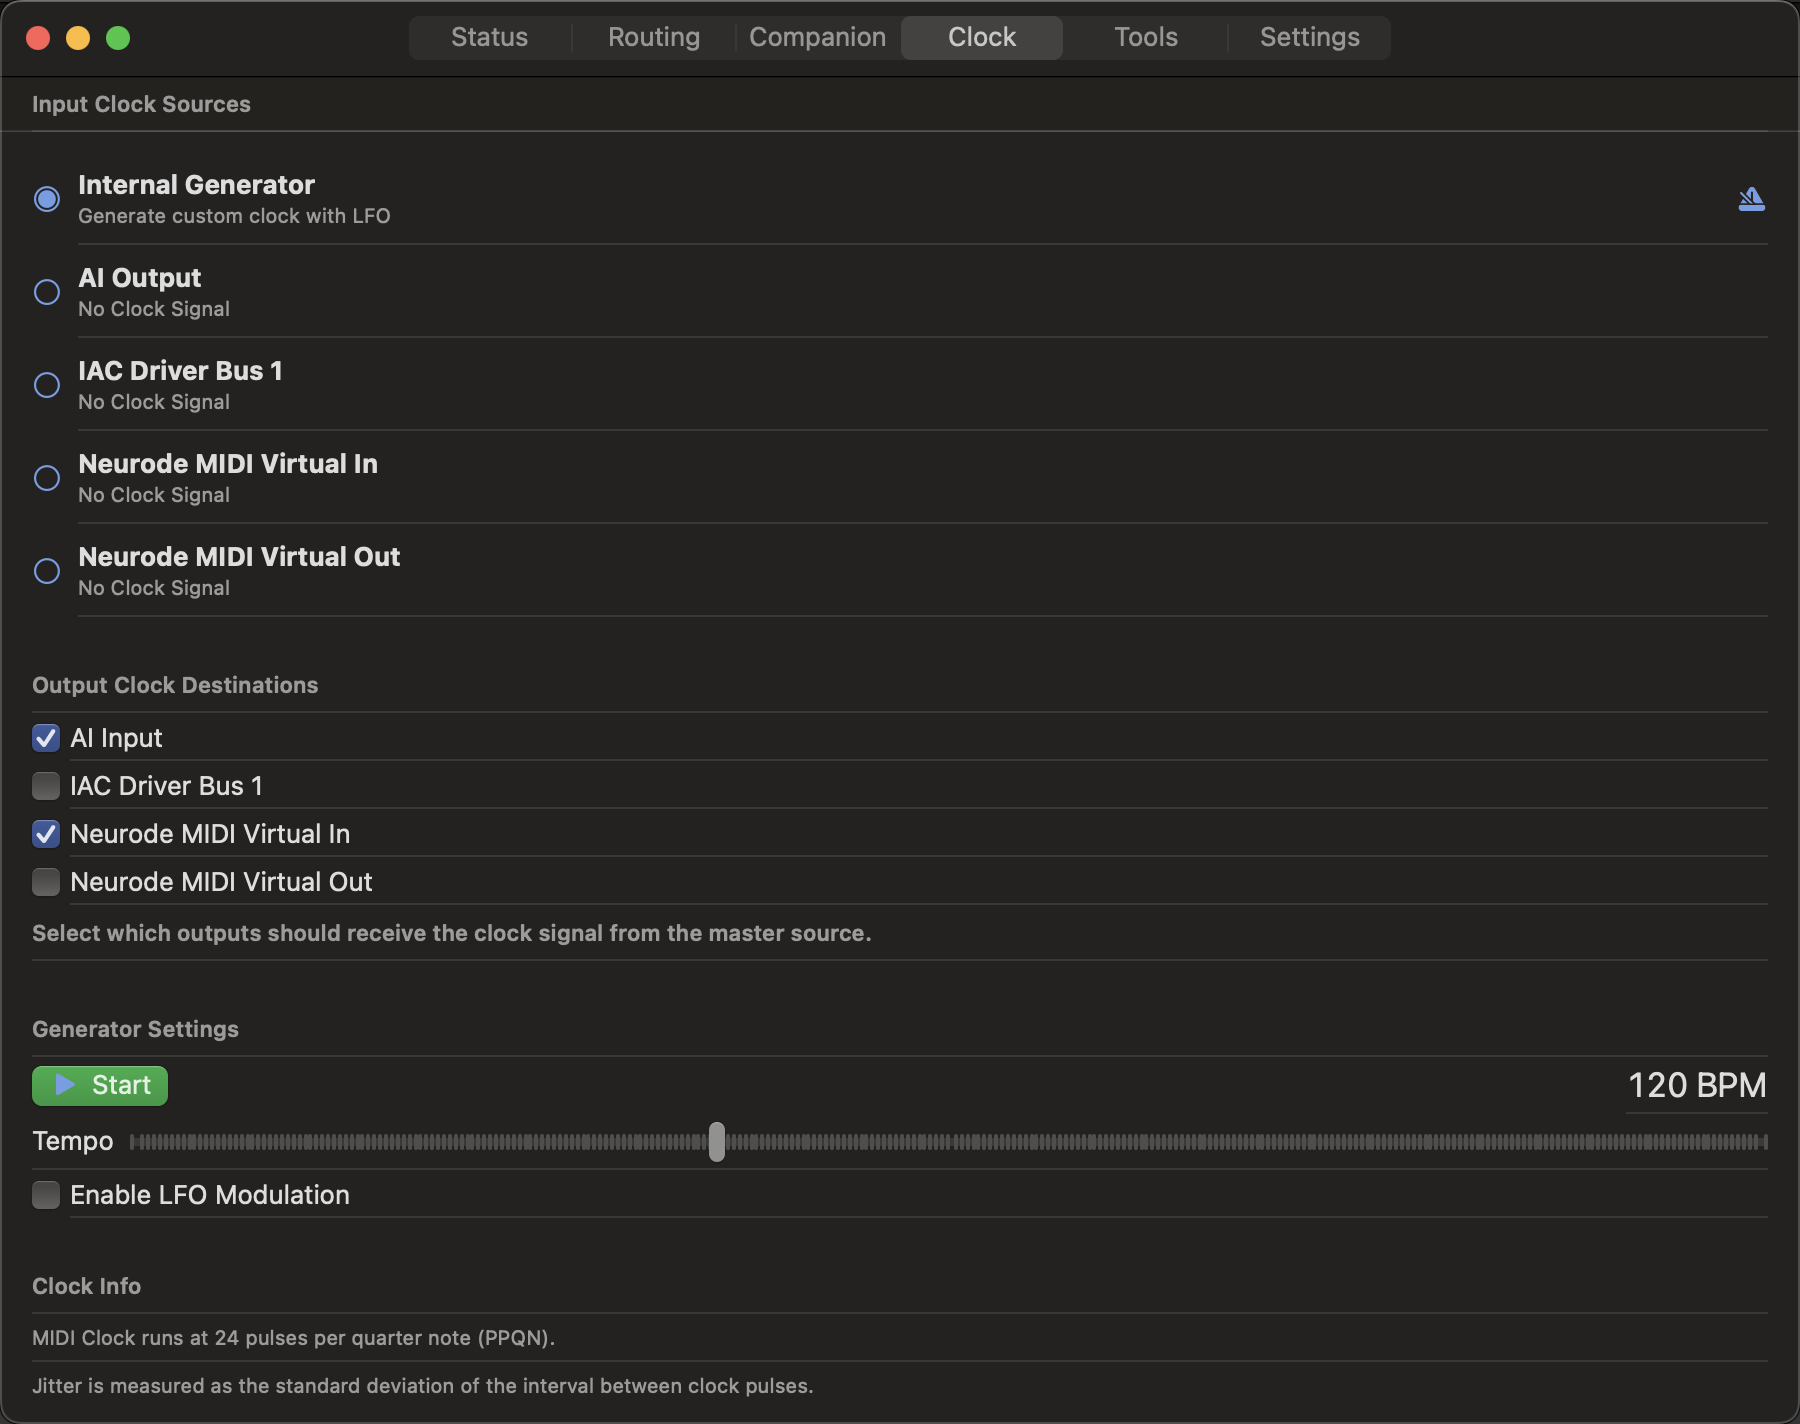
Clock Tab
Master clock and timing controls for synchronized performance.
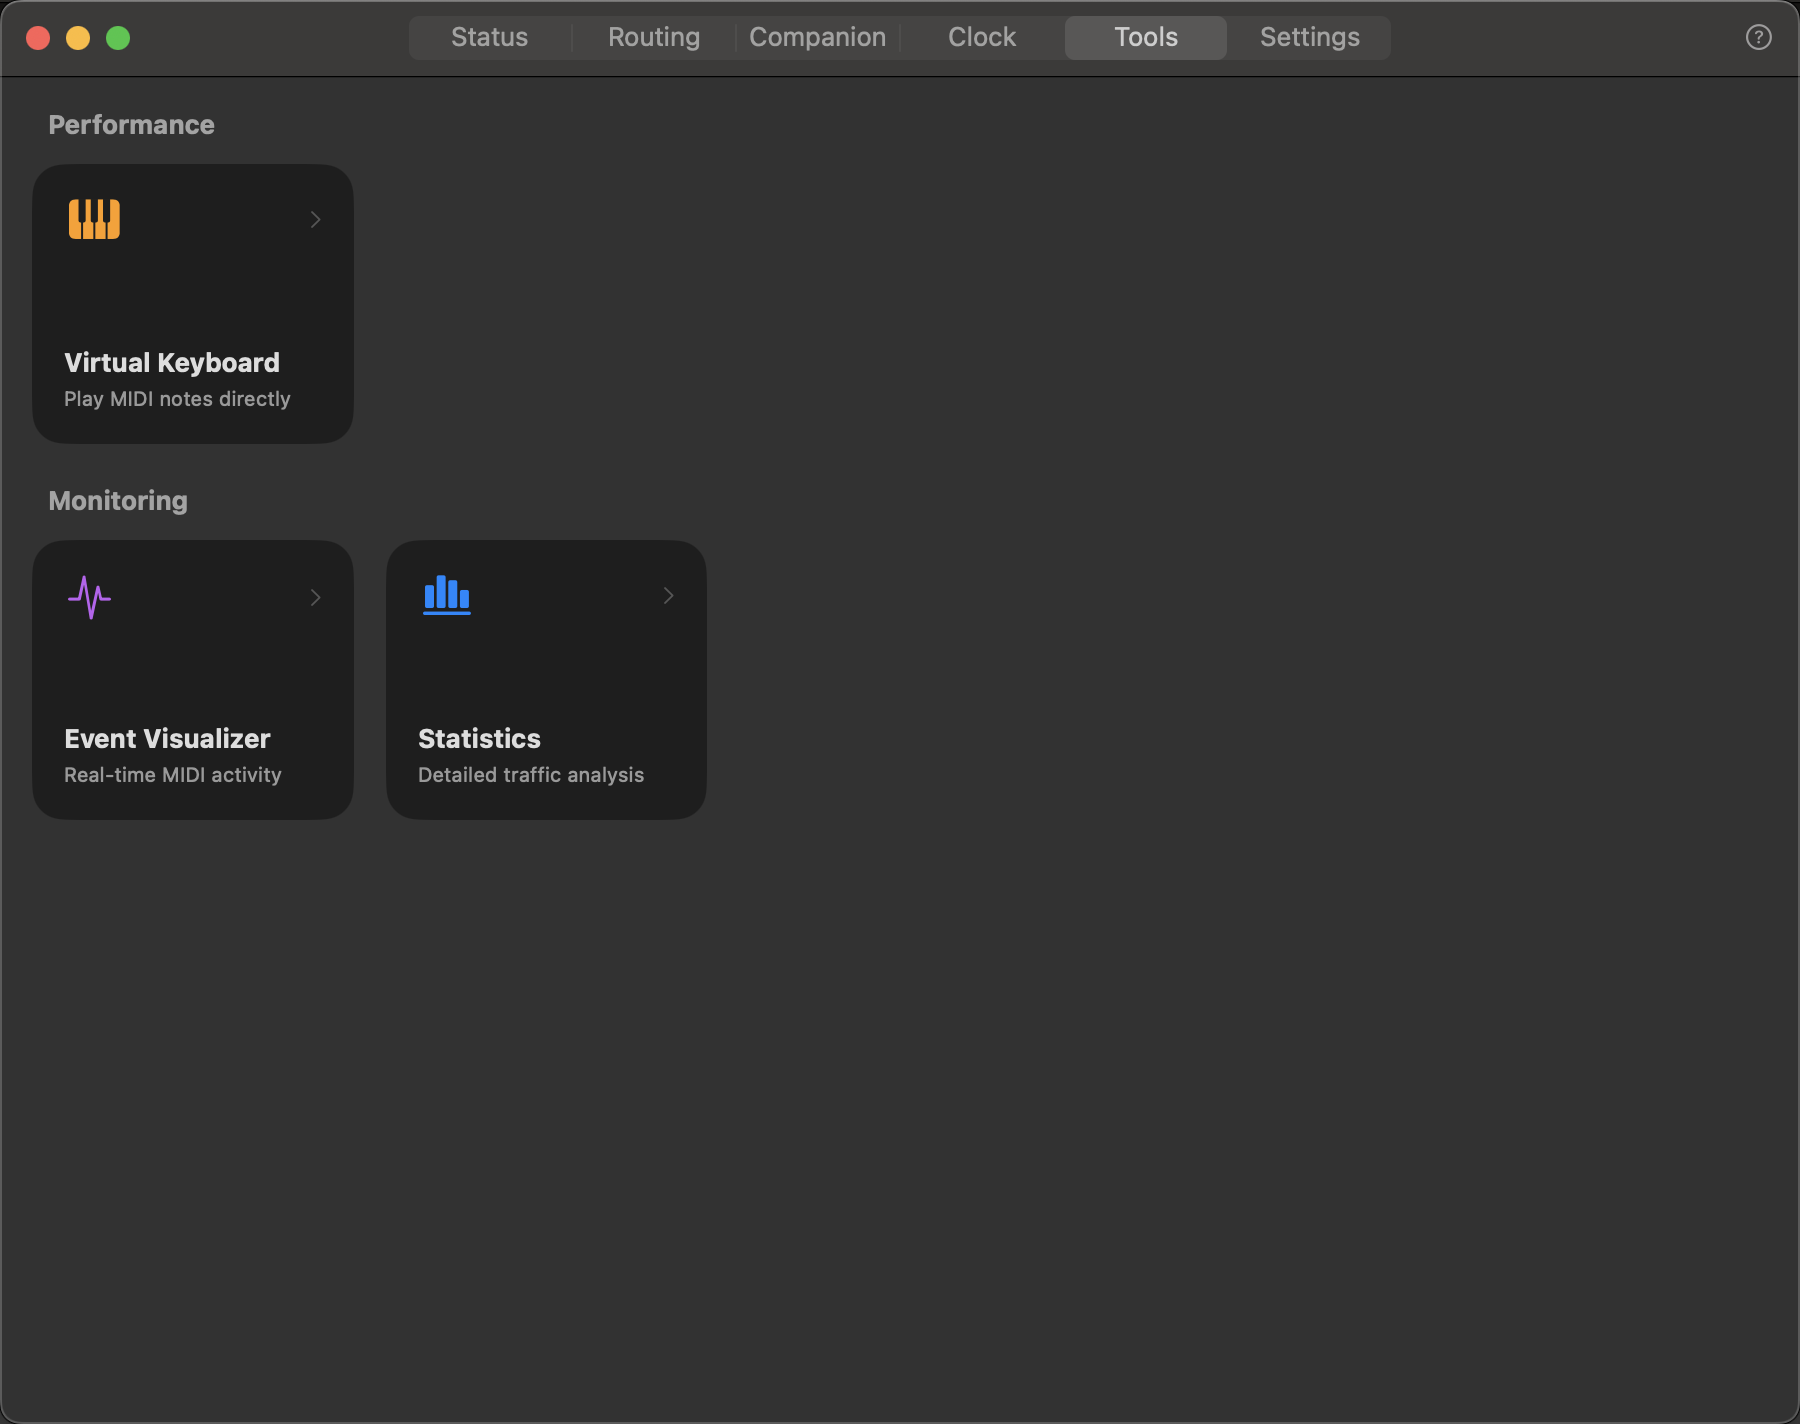
Tools Tab
Quick access to performance and monitoring utilities.
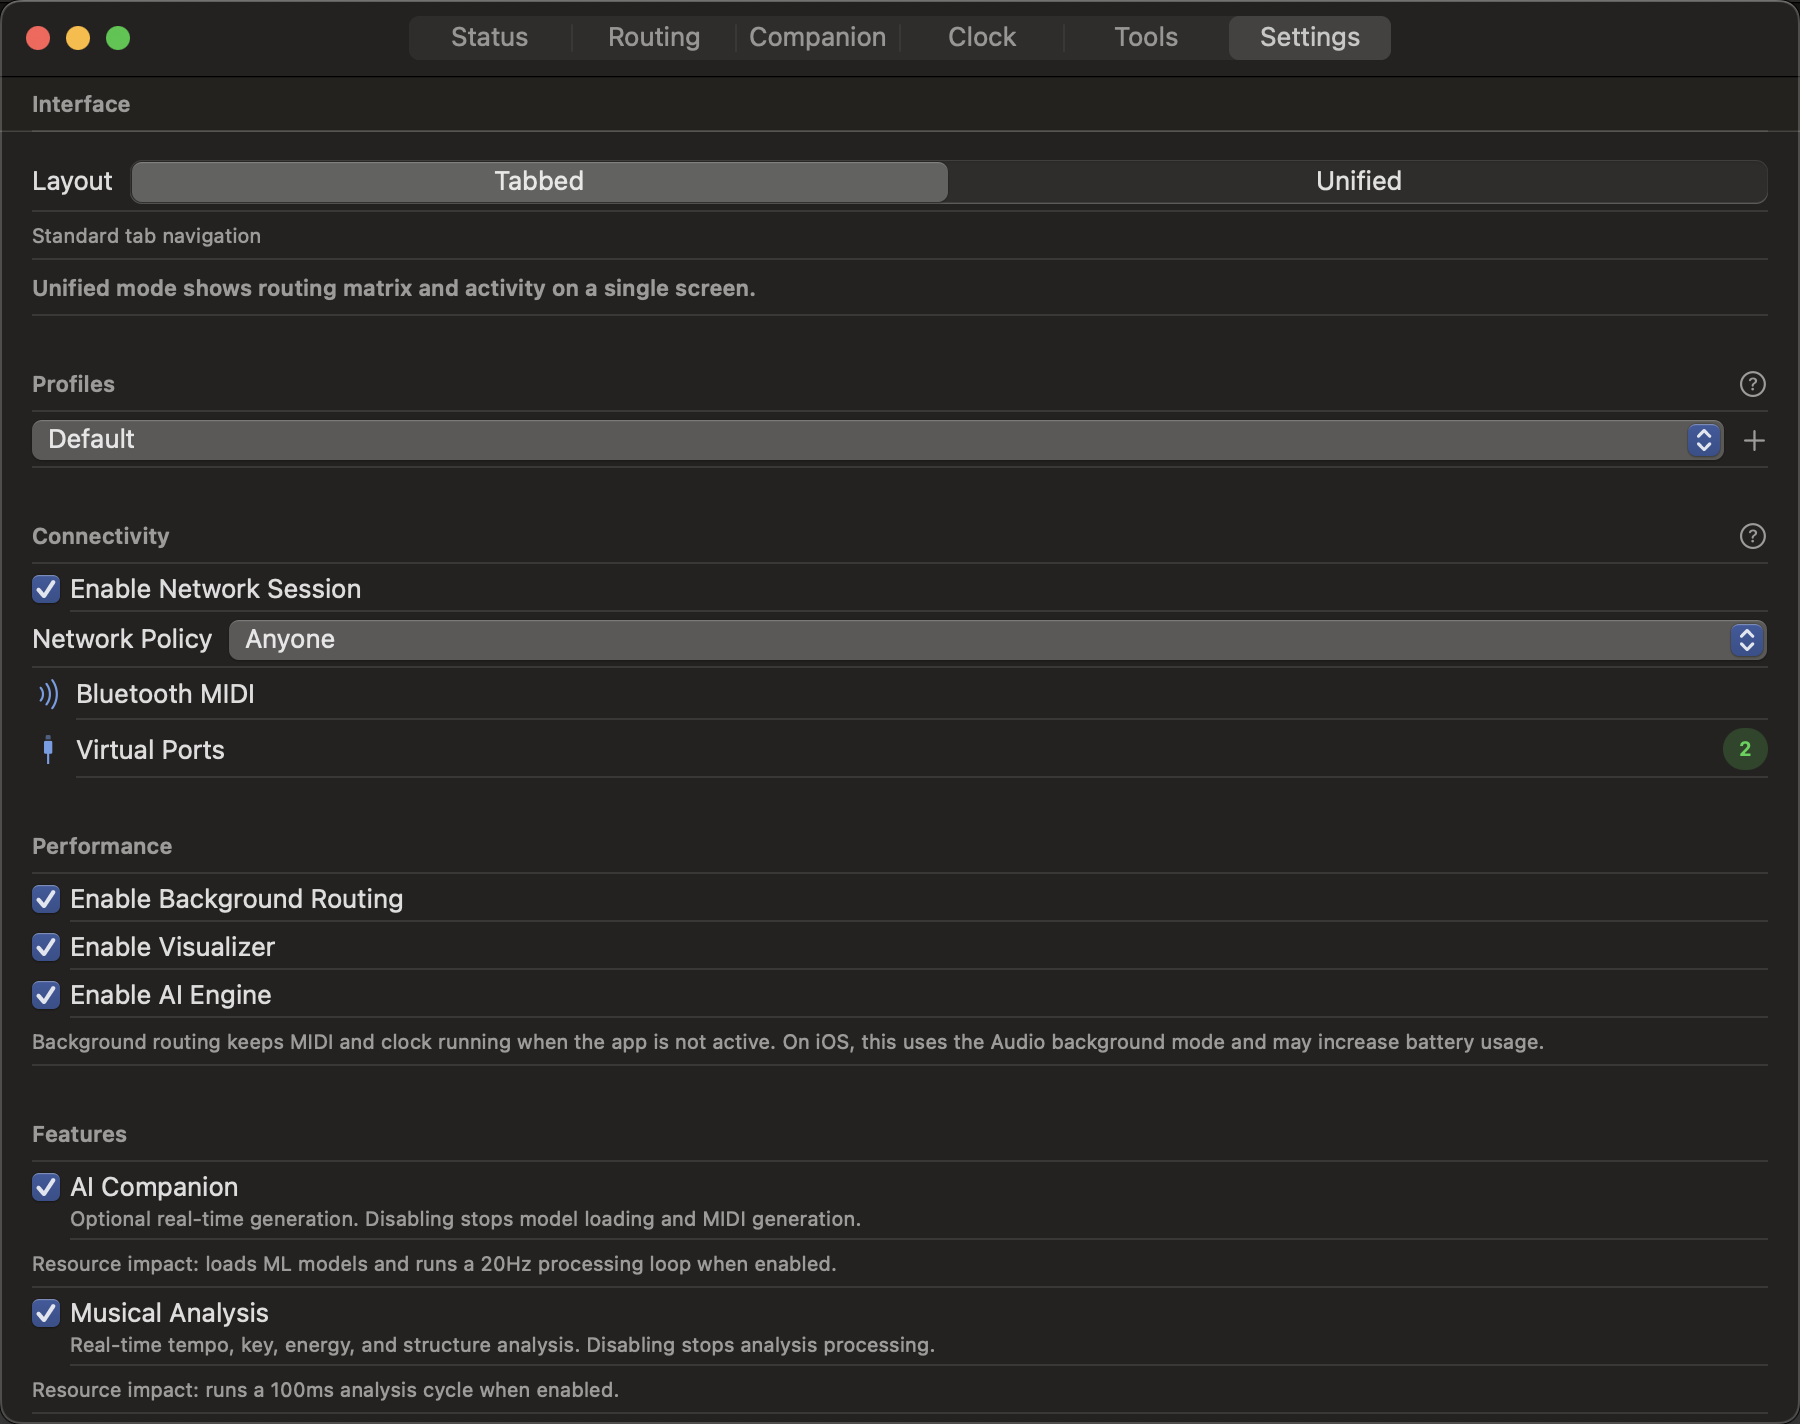
Settings Tab
Configure application behavior and preferences.
Main Views
Dashboard View
The default view showing your routing setup at a glance:
- Sources — Left panel, shows all MIDI inputs
- Routes — Center panel, shows active connections with stats
- Destinations — Right panel, shows all MIDI outputs
- Toolbar — Top bar with quick actions and view switcher
Quick Actions:
- + — Create new route
- ⚙️ — Settings
- 🛠️ — Tools panel
- 📊 — Statistics view
- 🔍 — Search routes
Flow Graph View
Visual representation of your routing setup:
- Nodes — Devices (sources and destinations)
- Edges — Routes connecting devices
- Pulses — Real-time MIDI activity visualization
- Colors — Indicate message types and activity levels
Interactions:
- Click node — Show device details
- Click edge — Edit route
- Drag nodes — Rearrange graph layout
- Pinch/zoom — Scale view (iPad/iPhone)
Unified View
Single-column layout optimized for smaller screens:
- Stacks sources, routes, and destinations vertically
- Collapsible sections
- Same functionality as Dashboard
iPad & iPhone
On iPad, rotate to portrait for Unified View. On iPhone, this is the default layout.
Panels & Details
Source Details
Click any source to see:
- Device name and manufacturer info
- Active channels (1-16)
- Message types being sent
- Activity graph (last 60 seconds)
- Connection status (USB, Bluetooth, Virtual)
Route Editor
Edit an existing route:
- Source/Destination selectors
- Channel filter (checkboxes for channels 1-16)
- Transform stack (add, reorder, remove)
- Statistics (messages, latency, throughput)
- Enable/Disable toggle
Destination Details
Click any destination to see:
- Device name and configuration
- Receiving channels
- Incoming routes (list of routes targeting this destination)
- Activity graph
Toolbar & Navigation
Top Toolbar
- View Switcher — Dashboard / Flow Graph / Unified
- Search — Filter routes by name
- Add Route — Quick create
- Tools — Open tools panel
- Settings — App configuration
Tools Panel (Slide-out)
Quick access to utilities:
- Virtual Keyboard — Test routing without hardware
- MIDI Monitor — Raw message viewer
- Event Visualiser — Graphical message timeline
- Clock Analyser — Tempo and sync diagnostics
Settings Panel
Configure app behaviour:
- General — App preferences
- Virtual Ports — Create custom MIDI ports
- Bluetooth — Pair and manage Bluetooth MIDI devices
- Profiles — Save/load routing configurations
- Advanced — Diagnostic and debugging tools
Status Indicators
Activity Indicators
- Green pulse — MIDI activity in last second
- Gray — Inactive
- Red — Error or disconnected
- Yellow — Warning (e.g., high latency)
Message Counters
Real-time stats on each route:
- Messages/sec — Current throughput
- Total — Cumulative count
- Latency — Processing delay
Keyboard Shortcuts (macOS)
| Action | Shortcut |
|---|---|
| New Route | ⌘N |
| Delete Route | ⌘⌫ |
| Toggle Tools | ⌘T |
| Settings | ⌘, |
| Search Routes | ⌘F |
| Dashboard View | ⌘1 |
| Flow Graph View | ⌘2 |
| Virtual Keyboard | ⌘K |
| MIDI Monitor | ⌘M |
Touch Gestures (iPad/iPhone)
- Tap — Select or activate
- Long press — Context menu
- Swipe left on route — Delete
- Swipe right on route — Duplicate
- Pinch — Zoom Flow Graph
- Two-finger drag — Pan Flow Graph
Customization
Layout Preferences
Settings → General → Layout:
- Default view — Choose startup view
- Panel sizes — Adjust relative widths
- Compact mode — Reduce padding for more density
Theme
Settings → General → Appearance:
- Auto — Follow system
- Light — Bright background
- Dark — Dark background (default)
Next Steps
- Common Workflows — See how to use the interface for real tasks
- Routing Concepts — Understand the routing model
- Tools & Utilities — Deep dive into the Tools panel
Pro Tip
Pin the Flow Graph to a second display during live performance for instant visual feedback without switching views.